| Area |
Mainstem Klamath |
| Topic |
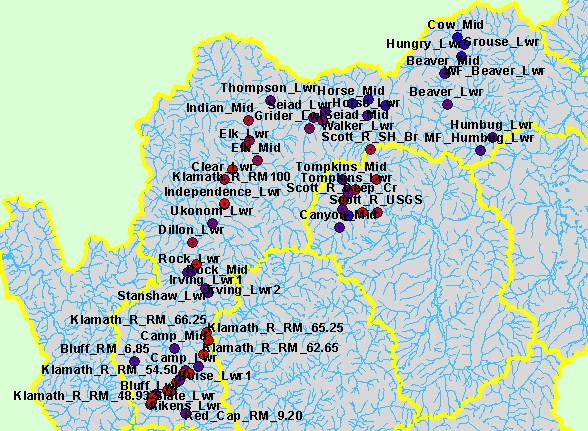
Temperature: MWAT at Many Mainstem Klamath Sites by Year 1997-2002 |
|
This map shows the locations of temperature monitoring stations in the Middle Klamath sub-basin, displayed with 1:100,000 scale
perennial streams and sub-basins. Points are color-coded by maximum weekly average temperature (MWAT). Data for this
1997-2002 temperature database were contributed by Klamath National Forest and the Karuk Tribe. Scale = 1:894,453 .
|
|
|
 |
 |
To view metadata about a map layer, click on a link in the table below.
| Name of Layer in Map Legend | Metadata File Name |
|---|
| Temperature Monitoring Pts (KNF) | temps_knf_mwats.shp.txt |
| Temperature Monitoring Pts (KNF) | temps_knf_mwats.shp.txt |
| Streams (1:100k scale)(no labels) | Unavailable |
| Subbasins (no labels) | tfsubwsd.shp.txt |
| Frame Project Outline | Unavailable |
| Elevation (meters)(USGS)(TIFF) | Unavailable |
| Klamath Basin | Unavailable |