| Area | Basin-wide/Regional |
| Topic | WQ: Total Suspended Solids MDEP Stormflow Study Summary 2000-2002 |
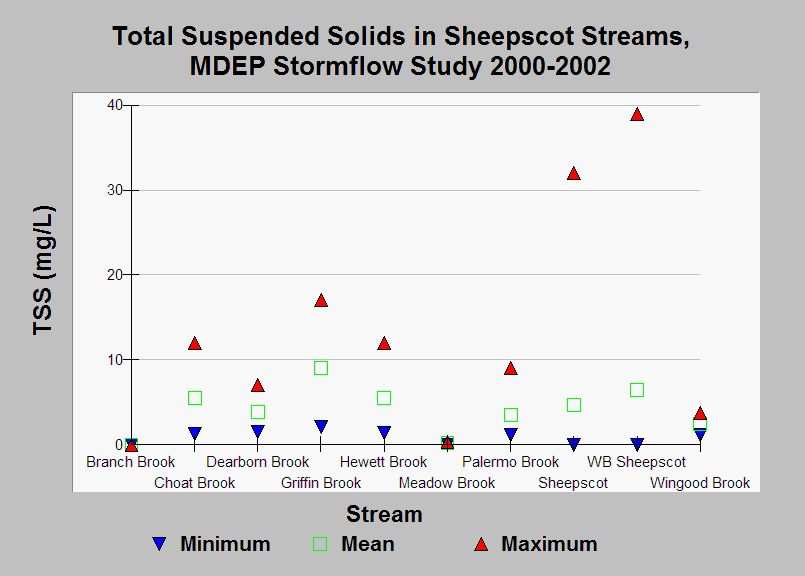
| Caption: This chart shows the minimum, mean, and maximum total suspended solids (TSS) concentrations measured during the Maine Department of Environmental Protection WQM Program's 2000-2002 stormflow study. Samples were taken during high flow events (after major rainfall events of 1.0 inch of rain or more, or during significant melt events). Whiting (2002) notes that according to Newcombe and Jensen (1996), these TSS values will cause at least short-term reductions in feeding rates for salmon parr. TSS levels that remain over 20 mg/L for 24 hours can cause minor physiological stress, with moderate physiological stress resulting from 48-hour exposure (Newcombe and Jensen (1996), but the number of samples in the MDEP Sheepscot dataset is not high enough to precisely determine the duration of exposure. See Info Links for more information. | |
 |
To learn more about this topic click Info Links .
To view additional information (data source, aquisition date etc.) about this page, click Metadata .
To view the table with the chart's data, click Chart Table web page.
To download the table with the chart's data, click wq_bw_dep_69_02_stormflow_summary.db (size 18,432 bytes)
To download the table with the chart's data as an Excel spreadsheet, click wq_bw_dep_69_02_stormflow_summary.db.xls (size 21,961 bytes) .
| www.krisweb.com |
