| Area | Basin-wide/Regional |
| Topic | WQ: E. Coli counts SVCA Sites 1994-2003 |
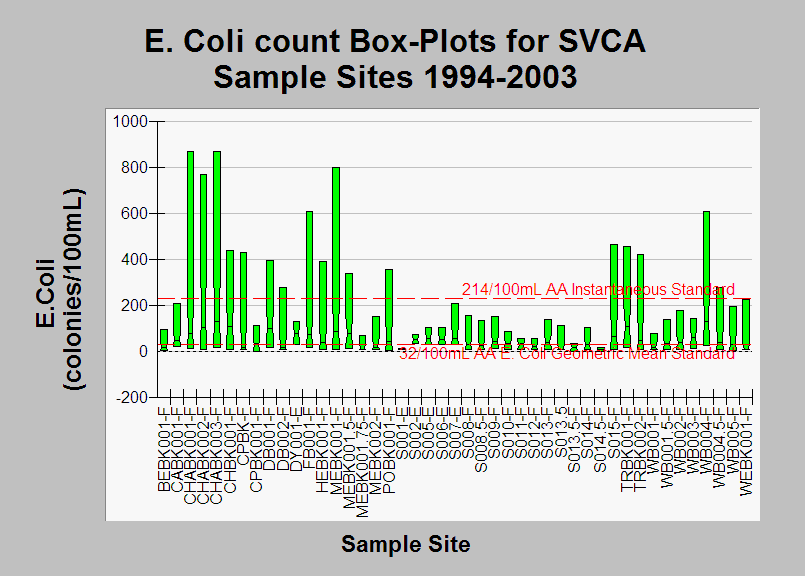
| Caption: This chart contains summary statistical data of all E.Coli laboratory data from SVCA sample sites between 1994 and 2003. The median of the data measurements are represented by the notches, the 10th and 90th percentiles are represented by the ends of the boxes. The 5th and 95th percentile were excluded from the chart because the extreme values skew the chart axis such that the other data are difficult to read. The reference lines show the AA geometric (32/100mL) and instantaneous (214/100mL) Standards that were developed to represent the E.Coli occurrence in natural waters. E.Coli levels in the Sheepscot exceed these standards at many locations in the basin. High levels of E. Coli indicate a possible contamination problem from raw sewage or animal wastes. See Info Links for more information. | |
 |
To learn more about this topic click Info Links .
To view additional information (data source, aquisition date etc.) about this page, click Metadata .
To view the table with the chart's data, click Chart Table web page.
To download the table with the chart's data, click wq_bw_svca_94-03_ecoli_summary.db (size 8,192 bytes)
To download the table with the chart's data as an Excel spreadsheet, click wq_bw_svca_94-03_ecoli_summary.db.xls (size 12,624 bytes) .
| www.krisweb.com |
