| Area | Lower Garcia / Estuary |
| Topic | Temperature: Min, Max, Avg Main Garcia River at Oz Hole 2001 |
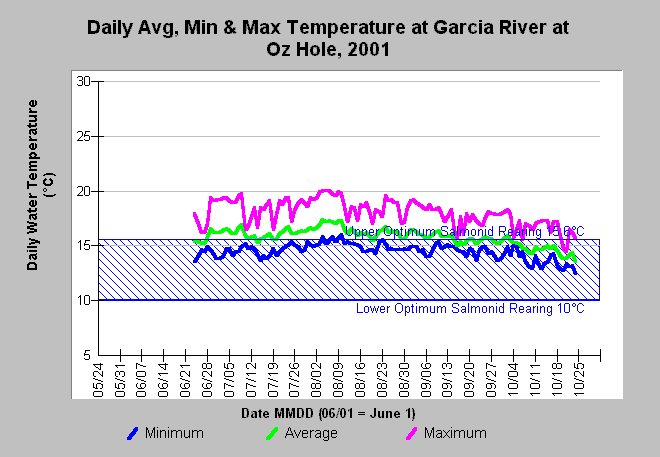
| Caption: This Chart shows the daily minimum, maximum, and average water temperature in Celsius (°C) of the Garcia River at Oz Hole (site GAR_OZ) for the year 2001. Daily maximum and average water temperatures exceeded the optimum range for juvenile salmonids from June through September, but night time minimum temperatures fell back within this range except for three or four days in August. This allows salmonids to partially recover from stressful day time temperatures. The reference value of 10-15.6°C optimum temperature range for juvenile salmonid rearing is based on McCullough (1999). See InfoLinks for more information. Data were contributed by the Friends of the Garcia River. Click on Map to see locations of temperature monitoring stations. | |
 |
To learn more about this topic click Info Links .
To view additional information (data source, aquisition date etc.) about this page, click Metadata .
To view the table with the chart's data, click Chart Table web page.
To download the table with the chart's data, click temp_gar_frog_94_01_bw_daily.db (size 202,752 bytes) .
To view the table with the chart's source data, click Source Table web page.
To download the table with the chart's source data, click tempraw_gar_frog_94_01.dbf (size 7,570,655 bytes)
| www.krisweb.com |
