 
 
| Area/Topic | Bibliography | Background | Hypotheses | Home | 
KRIS West Marin-Sonoma: Map Page
| Area | Lagunitas Creek | 
| Topic | Climate: Bear Valley HQ Rainfall Max Consecutive Hours 1975-1998 | 
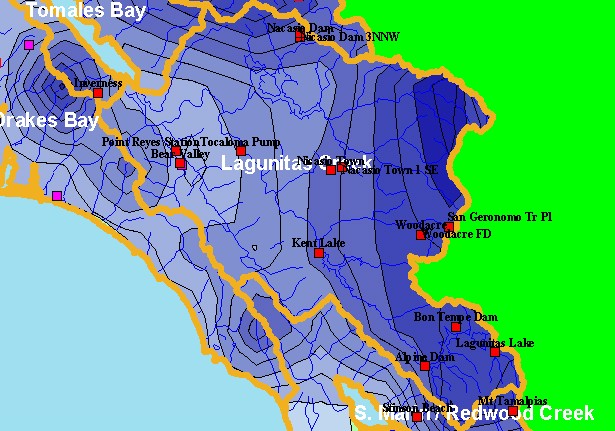
| This is a map of rain gauges in the Lagunitas Creek sub-basin, provided to KRIS by California Department of Water Resources (DWR) and Point Reyes National Seashore (PORE). Displayed in the background are KRIS sub-basins and the annual rainfall model from Oregon State University. Low-elevation coastal areas have lower rainfall, whereas interior gauges near mountains have greater precipitation. | |||
|  |  | ||
To view metadata about a map layer, click on a link in the table below.
| Name of Layer in Map Legend | Metadata File Name | 
|---|---|
| Rain Gages (DWR) | raingages_wms_dwr.shp.txt | 
| Rain Gages (PORE) | rain_guages.shp.txt | 
| Subbasins (w/ labels) | subbasins.shp.txt | 
| Frame Project Outline | Unavailable | 
| Streams (1:100k scale)(no labels) | streams100.shp.txt | 
| Mean Annual Rainfall (Inches) | rain61_90.shp.txt | 
| Topo Map, North (1:24k scale) | Unavailable | 
| Topo Map, South (1:24k scale) | Unavailable | 
| Elevation (10 m resolution) | elev10.tif.txt | 
| Project Background | Unavailable | 
| www.krisweb.com |