| Area |
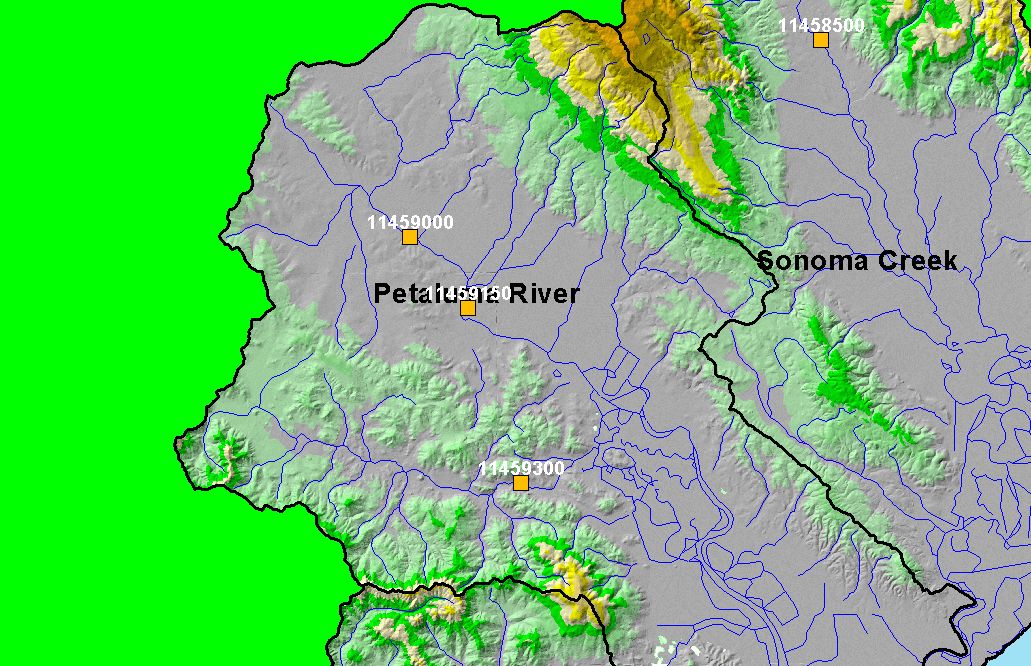
Petaluma River |
| Topic |
Flow: Monthly Average Petaluma River at Petaluma 1949-1963 |
To view a more detailed version of this map click
here
|
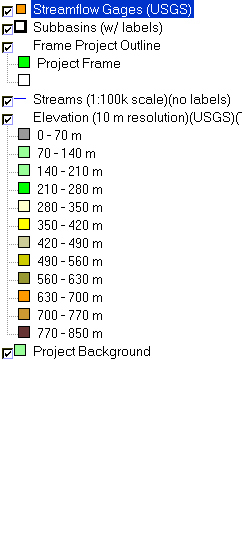
This is a map of streamflow gages in the Petaluma River sub-basin. Displayed in the background are KRIS sub-basins, an hillshade of elevation, and 1:100,000 scale
USGS hydrography.
|
|
|
 |
 |
To view metadata about a map layer, click on a link in the table below.
If you obtain KRIS on a CD and install it on your hard drive as a desktop program, you will have access to increased map capabilities such as zooming in/out, turning layers on/off, adding layers and changing legends.