| Area | South Fork |
| Topic | Temperature: Floating Weekly Average at SF/Main GRWC Sites in 2000 |
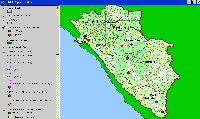
The image above from the KRIS Gualala Map project shows the location of Gualala River Watershed Council temperature data probes. Red symbols indicate ranges of water temperatures over those known to support coho salmon (16.8 C MWAT, see Welsh et al., 2001), while green means that habitat conditions were suitable in that year. The upper South Fork is at the very bottom of the image.
 Click on image to enlarge (91K).
To learn more about this topic click Info Links
| www.krisweb.com |
