| Area | South Fork |
| Topic | Temperature: Distribution of Temperature Readings in South Fork |
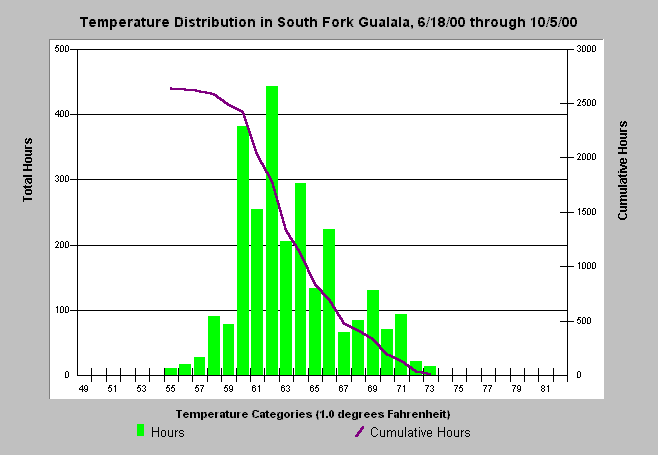
| Caption: This chart shows the distribution of hourly temperature readings by 1.0 degree Celsius temperature categories (green bars), and cumulative hours that the temperature exceeded any temperature (purple line) for the South Fork Gualala in 2000. Click on the bars or the line for specific values from the respective metrics. The South Fork ran warmer than 60 degrees for 2415 hours, warmer than 62 degrees for 1779 hours, and warmer than 65 for 837 hours. Data collected by Gualala River Watershed Council. See Info Links for more information. | |
 |
To learn more about this topic click Info Links .
To view a table of information about this data click Metadata .
To view the table with the chart's data, click Chart Table web page.
To download the table with the chart's data, click tempf_grwc_2000_cumsum.db (size 10,240 bytes) .
To view the table with the chart's source data, click Source Table web page.
To download the table with the chart's source data, click tempraw_grwc_2000.dbf (size 1,737,254 bytes)
| www.krisweb.com |
